pISSN : 3058-423X eISSN: 3058-4302
Open Access, Peer-reviewed

pISSN : 3058-423X eISSN: 3058-4302
Open Access, Peer-reviewed

Tuan Khoi Tran,Waewta Kuwatjanakul,Lumyai Wonglakorn,Kittipan Samerpitak
10.17966/JMI.2026.31.3.128 Epub 2026 October 01
Abstract
Background: Accurate Fusarium identification is crucial for case reporting and due to species-specific antifungal susceptibilities. Although internal transcribed spacer (ITS) is the standard fungal barcode, its poor resolution in Fusarium necessitates alternatives such as TEF1-α, whose clinical utility for human pathogens remains systematically unevaluated.
Objective: To determine whether ITS or TEF1-α provides the most reliable single-locus identification for routine clinical use across 28 human-pathogenic Fusarium species.
Methods: Curated ITS (n = 341) and TEF1-α (n = 320) sequences of 28 Fusarium species were retrieved from GenBank, quality-filtered, and aligned with MAFFT v7. Each locus was evaluated by two criteria, viz., formation of well-supported monophyletic clades on neighbor-joining trees (K2P model, 1,000 bootstrap replicates) and presence of a clear barcoding gap (mean intraspecific distance < minimum interspecific distance).
Results: ITS resolved 22 of 28 species (78.6%), failing to discriminate three clinically important species pairs, viz., F. fujikuroi / F. proliferatum, F. equiseti / F. incarnatum, and F. subglutinans / F. verticillioides. TEF1-α resolved all 28 species via monophyletic clustering and clear barcoding gaps; 26 species formed well-supported clades (≥70% bootstrap), whereas two species (F. keratoplasticum and F. solani) clustered with lower support but distinct barcoding gaps.
Conclusion: TEF1-α is the optimal single-locus DNA barcode for the routine identification of human-pathogenic Fusarium. The species-level resolution map and curated reference datasets presented here provide a ready-to-use framework for laboratories adopting TEF1-α-based identification.
Keywords
DNA barcoding Fusarium ITS TEF1-α
Fusarium species rank among the most clinically important non-Aspergillus filamentous fungi, occurring ubiquitously in the environment—recovered from soil, water, air, and critically for healthcare settings, colonizing hospital water distribution systems, drains, and showerheads, thereby creating persistent reservoirs for nosocomial exposure1-3. Superficial infections, primarily onychomycosis and keratitis, occur with an increasing frequency worldwide, with Fusarium keratitis representing a major etiology of fungal corneal disease in tropical and subtropical regions and among contact-lens wearers4. Further- more, in immunocompromised patients—particularly those with prolonged neutropenia, hematological malignancies, or after hematopoietic stem-cell transplantation—Fusarium can cause disseminated fusariosis, with high mortality rates despite aggressive antifungal therapy5.
Most clinically significant isolates belong to six species complexes—F. solani (FSSC), F. oxysporum (FOSC), F. fujikuroi (FFSC), F. incarnatum–equiseti (FIESC), F. chlamydosporum (FCSC), and F. dimerum (FDSC)—together with F. sporo- trichioides. Table 1 summarizes their reported clinical features. FSSC and FOSC together account for ~80% of invasive fusariosis, although considerable regional variation exists1. Crucially, constituent species within a single complex can exhibit substantial differences in antifungal susceptibility—for instance, F. solani sensu stricto demonstrates intrinsic azole resistance, whereas certain closely related taxa are more susceptible. Consequently, species-level identification is not merely a taxonomic exercise; it directly informs anti-fungal selection, epidemiological surveillance, and outbreak investigation6-8.
|
Species |
Clinical
features |
|
F. solani species
complex (FSSC); F. solani, F. keratoplasticum, F. falciforme, |
- The
leading global cause of fungal keratitis13 - A major
agent of haematogenous disseminated fusariosis14 - Reported
intrinsic resistance to azoles13 - 72-74%
mortality despite therapy in invasive cases14,15 |
|
F. dimerum species
complex (FDSC); |
- Keratitis16 - Catheter-related
bloodstream infection17 - Endocarditis and onychomycosis in severely
immunocompromised hosts18 |
|
F. fujikuroi species
complex (FFSC); |
- Keratitis19 - Fatal
fungemia in a lung cancer patient20 |
|
F. incarnatum-equiseti
species complex (FIESC); |
- Invasive
fusariosis21,22 - Wound
infection23 |
|
F. chlamydosporum
species complex (FCSC); |
- Fungemia in aplastic anemia and lymphocytic
lymphoma patient24,25 |
|
F. oxysporum species
complex (FOSC) F. oxysporum |
- A common agent of filamentous-contact-lens
keratitis and onychomycosis13 - Fatal bloodstream or disseminated infection in COVID-19, HSCT, and neutropenic patients1,26 |
|
F. sporotrichioides |
- Wound
infection in a diabetes mellitus patient27 |
Species-level identification has traditionally depended on morphology from cultured isolates. Nevertheless, this appro- ach has well-recognized limitations, including numerous clinically relevant taxa being cryptic members of species complexes, diagnostic structures possibly requiring specific conditions or time to develop, and overlapping morphological features frequently resulting in misidentification. Consequently, morphology-based identification in routine clinical practice typically resolves only to the species-complex level, masking clinically relevant differences in resistance profiles and virulence potential1.
Molecular identification using DNA barcoding represents a faster and more reproducible alternative. The nuclear ribo- somal internal transcribed spacer (ITS) region was adopted as the universal primary barcode for fungi by the Fungal Barcoding Consortium and remains the most frequently sequenced locus in clinical laboratories worldwide, due to its incorporation into commercial identification kits and its extensive representation in public databases9. Despite being the universal standard for fungal DNA barcoding in clinical laboratories, the ITS region lacks the precision to accurately differentiate closely related Fusarium species. In this regard, the TEF1-α gene has emerged as a strong alternative for Fusarium identification9,10. In fact, the Clinical and Laboratory Standards Institute MM18 guideline and several authoritative resources have already established TEF1-α as the preferred molecular target for Fusarium identification at the species level11,12. Although these expert recommendations are well established, to our knowledge, a systematic quantitative validation across the human-pathogenic Fusarium species—together with a practical species-resolution map directly applicable to clinical laboratory decision-making—has not been published.
Therefore, the present study was designed to quantitatively validate the discriminatory performance of TEF1-α compared with that of ITS across 28 clinically documented human-pathogenic Fusarium species and provide a ready-to-use, species-by-species resolution framework for routine clinical mycology laboratories.
1. Species selection, sequence retrieval, and quality control
A total of 28 species (summarized with clinical features in Table 1) were selected according to the following three criteria: (1) documented human pathogens, (2) valid Myco- Bank28 nomenclature (accessed October 2025) with synonyms cross-checked and resolved to unify accepted names, and (3) representation in GenBank29 by type or other reference sequences (e.g., CBS and ATCC).
For these species, the entire ITS (ITS1–5.8S–ITS2) region (ITS1/ITS4)30 and the specific TEF1-α fragments (EF1-728F/ EF1-986R31 or EF1-1018F/EF1-1620R32) were retrieved from GenBank (on October 26, 2025, and May 12, 2026), priori- tizing type and reference records. All accession numbers are listed in Table 2. For non-type sequences, only those exhibiting ≥98% BLAST33 identity to the corresponding ex-type sequence at the same locus were retained.
|
No. |
Species |
GenBank accession numbers |
|
|
ITS |
TEF1-α |
||
|
1 |
F. biseptatum |
NR_137706.1, MT320778.1,
EU926251.1, |
MW811086.1, EU926322.1 |
|
2 |
F. chlamydosporum |
NR_172283.1, KX421422.1,
KP769538.1, |
MN120754.1, KY211036.1, KM655867.1, |
|
3 |
F. cyanescens |
MT812608.1, EU329684.1, AB190389.1 |
MZ359432.1, MT721102.1, MN178226.1 |
|
4 |
F. delphinoides |
NR_130680.1, KP132211.1, KJ690090.1, |
KR673915.1, KY906207.1, KU738439.1, |
|
5 |
F. dimerum |
KT876560.1, KR139925.1, KP132213.1, |
KR673912.1, KC572088.1,
KY556708.1, |
|
6 |
F. equiseti |
NR_121457.1, KR094440.1,
KC311517.1, |
KY365612.1, KP400714.1,
KF499577.1, |
|
7 |
F. falciforme |
NR_164424.1, KF179255.1, KC808241.1, |
OQ511044.1, KF020507.1, PQ037375.1, MT772141.1, MG195133.1, KP773275.1, |
|
8 |
F. fujikuroi |
NR_111889.1, KU991656.1, KP942371.1, |
PP302045.1, MN534010.1, OP597802.1, |
|
9 |
F. incarnatum |
KX184815.1, KP133059.1, MZ476176.1, |
MN170476.1, KT224221.1, KU923386.1, |
|
10 |
F. keratoplasticum |
NR_130690.1, KC808259.1, MZ501953.1, |
JN235713.1, LT906670.1, MN178243.1, KU933434.1,
PQ632753.1, PQ632681.1, LC177267.1, OQ511057.1, JF740786.1, OR227642.1 |
|
11 |
F. lichenicola |
NR_173410.1, KM921661.1, KP132217.1, |
KP903345.1, ON959340.1, MT159821.1, |
|
12 |
F. metavorans |
NR_165517.1, MT812650.1, MW757220.1, |
MZ359447.1, MT721098.1, LR583627.1, |
|
13 |
F. nelsonii |
MN117676.1, PV562993.1, OR018402.1, |
OP486861.1, GQ505404.1, MN120761.1, |
|
14 |
F. ngaiotongaense |
NR_178144.1, OR764849.1, OM811278.1, |
MW620176.1, MW620175.1, LR583621.1 |
|
15 |
F. oxysporum |
MH866031.1, MW008867.1, MN688880.1, |
MH485044.1, MZ078992.1, MT630334.1, |
|
16 |
F. penzigii |
NR_137707.1, KY318487.1,
KT804155.1, |
EU926324.1, HM347132.1 |
|
17 |
F. petroliphilum |
KC254043.1, KJ125736.1, KP132225.1, |
KJ867424.1, KC808215.1, MF467468.1, |
|
18 |
F. proliferatum |
AF291061.1, KP132230.1, MK814399.1, |
PP782633.1, PV551209.1, MW331500.1, |
|
19 |
F. sacchari |
NR_174875.1, AB374078.1,
EF453121.1, |
KT716211.1, MW402115.1,
MK125534.1, |
|
20 |
F. solani |
NR_163531.1, KT313635.1, KM268684.1, |
KP400704.1, PQ559704.1, MK503785.1, |
|
21 |
F. sporotrichioides |
KU935671.1, KJ081759.1,
KC866348.1, |
KM025415.1, MZ078869.1,
MN120771.1, |
|
22 |
F. subglutinans |
NR_182424.1, KX681580.1, KJ125694.1, |
KM462951.1, KC514067.1, MK896868.1, |
|
23 |
F. suttonianum |
NR_172216.1, PV607010.1, PP421949.1, |
ON032462.1, PP717887.1, PQ632734.1, |
|
24 |
F. thapsinum |
KX171658.1, KF897831.1, KM212171.1, |
KY446437.1, KX151992.1, KF267264.1, JX268964.1, JQ717205.1, OP487076.1, |
|
25 |
F. tonkinense |
NR_170733.1, ON571655.1, OW987846.1, |
PQ741949.1, LT906672.1, MZ921928.1, |
|
26 |
F. variasi |
NR_177139.1, MN954341.1 |
MT009967.1, MT009969.1, MT009968.1 |
|
27 |
F. verticillioides |
KP132245.1, KR020684.1,
KF031434.1, |
MT010990.1, PV551208.1,
MN223455.1, |
|
28 |
F. yamamotoi |
NR_171058.1, AF178394.1, PV426251.1, OP782171.1 |
AF178336.1, AF178328.1 |
Raw downloads were filtered in BioEdit v7.734 to exclude duplicate strains, sequences with >1% ambiguous bases, fragments <80% of modal length (<440 bp for ITS35; <560 bp for TEF1-α36), and reads entirely outside primer boundaries. The retained sequences were saved into locus-specific files and terminally trimmed according to their respective primers, producing uniform, high-quality datasets for downstream analyses.
2. Phylogenetic tree construction
Each locus-specific dataset was aligned using MAFFT v737. The resulting alignments were examined in BioEdit v7.7, and poorly aligned sequences were removed where required. Neighbor-joining (NJ) phylogenetic trees were constructed in MEGA 1238 under the Kimura 2-parameter (K2P) model with pairwise deletion of sites containing gaps or ambiguous bases. Node support was evaluated with 1,000 bootstrap replicates. A species was considered to possess a well-resolved phylogenetic position when all its representative sequences formed a monophyletic cluster with high bootstrap support.
3. Barcoding gap analysis
For each species, the mean intraspecific distance and the minimum interspecific distance to other species were recorded. The mean rather than the maximum intraspecific distance was used for defining the barcoding gap because it represents the phylogenetic distance among all strains inside the species clade and is less sensitive than the maximum distance to outliers originating from misidentified or atypical strains in public databases.
A barcoding gap between species was considered present when the mean intraspecific distance was strictly less than the minimum interspecific distance. Intraspecific and interspecific K2P distances were plotted using the ggplot2 package39 in R v4.540 to visualize the DNA barcoding gap for each species.
4. Evaluation of fungal species using phylogeny and barcoding gap
Each species was scored at each locus according to two criteria—monophyly with sufficient bootstrap support and the presence of a barcoding gap—and classified as follows:
1) Good resolution (G)—the species forms a monophyletic clade with ≥70% bootstrap support and exhibits a positive barcoding gap (>0%).
2) Fair resolution (F)—the species exhibits a positive bar- coding gap but either (a) forms a monophyletic clade with <70% bootstrap support or (b) exhibits paraphyly with other species.
3) Poor resolution (P)—the species forms paraphyletic or polyphyletic cluster with other species and lacks a mutual barcoding gap (≤0% in at least one member). Both members are classified as poor, because reliable identification requires independent discrimination of each.
All species were summarized into the following three practical categories directly answering the clinical question: Category A—species classified as G or F at both loci (single-locus identification is feasible), Category B—species classified as P at one locus but G or F at the other (the alternative locus must be used), and Category C—species classified as P at both loci (multilocus typing is required). This classification is designed as a reference guide for clinical laboratories deciding which barcode to sequence for a given isolate.
1. Curated reference datasets
After quality-filtering, the ITS dataset comprised 341 se- quences, and the TEF1-α dataset comprised 320 sequences, representing all 28 species. Detailed compositions are pre- sented in Table 3.
|
No. |
Species |
ITS
dataset |
|
TEF1-α dataset |
||||
|
OTU |
Length
(bp) |
Type
seq. |
OTU |
Length
(bp) |
Type
seq. |
|||
|
1 |
F. biseptatum |
5 |
524 |
+ |
|
2 |
683 |
+ |
|
2 |
F.
chlamydosporum |
15 |
523 |
+ |
|
15 |
689 |
+ |
|
3 |
F. cyanescens |
3 |
528 |
|
|
3 |
702 |
|
|
4 |
F.
delphinoides |
15 |
522 |
+ |
|
15 |
681 |
+ |
|
5 |
F. dimerum |
15 |
525 |
+ |
|
14 |
675 |
+ |
|
6 |
F. equiseti |
15 |
506 |
+ |
|
18 |
672 |
+ |
|
7 |
F. falciforme |
15 |
529 |
+ |
|
13 |
691 |
+ |
|
8 |
F. fujikuroi |
16 |
519 |
+ |
|
12 |
662 |
+ |
|
9 |
F. incarnatum |
15 |
506 |
|
|
18 |
671 |
+ |
|
10 |
F.
keratoplasticum |
15 |
530 |
+ |
|
10 |
691 |
+ |
|
11 |
F.
lichenicola |
15 |
528 |
+ |
|
6 |
700 |
+ |
|
12 |
F. metavorans |
15 |
530 |
+ |
|
4 |
699 |
+ |
|
13 |
F. nelsonii |
5 |
523 |
|
|
4 |
691 |
|
|
14 |
F.
ngaiotongaense |
4 |
527 |
+ |
|
3 |
699 |
+ |
|
15 |
F. oxysporum |
15 |
504 |
|
|
17 |
671 |
+ |
|
16 |
F. penzigii |
8 |
522 |
+ |
|
2 |
688 |
+ |
|
17 |
F.
petroliphilum |
15 |
531 |
|
|
13 |
700 |
|
|
18 |
F.
proliferatum |
15 |
519 |
|
|
20 |
668 |
|
|
19 |
F. sacchari |
15 |
507 |
+ |
|
17 |
668 |
+ |
|
20 |
F. solani |
15 |
527 |
+ |
|
22 |
703 |
+ |
|
21 |
F.
sporotrichioides |
16 |
507 |
|
|
19 |
668 |
|
|
22 |
F.
subglutinans |
15 |
507 |
+ |
|
18 |
664 |
+ |
|
23 |
F.
suttonianum |
10 |
529 |
+ |
|
12 |
689 |
+ |
|
24 |
F. thapsinum |
15 |
518 |
|
|
17 |
666 |
|
|
25 |
F. tonkinense |
12 |
528 |
+ |
|
8 |
703 |
|
|
26 |
F. variasi |
2 |
528 |
+ |
|
3 |
706 |
+ |
|
27 |
F.
verticillioides |
16 |
507 |
|
|
13 |
668 |
|
|
28 |
F. yamamotoi |
4 |
529 |
+ |
|
2 |
704 |
+ |
|
|
Total |
341 |
|
19 |
|
320 |
|
20 |
2. Phylogenetically resolved species by ITS and TEF1-α
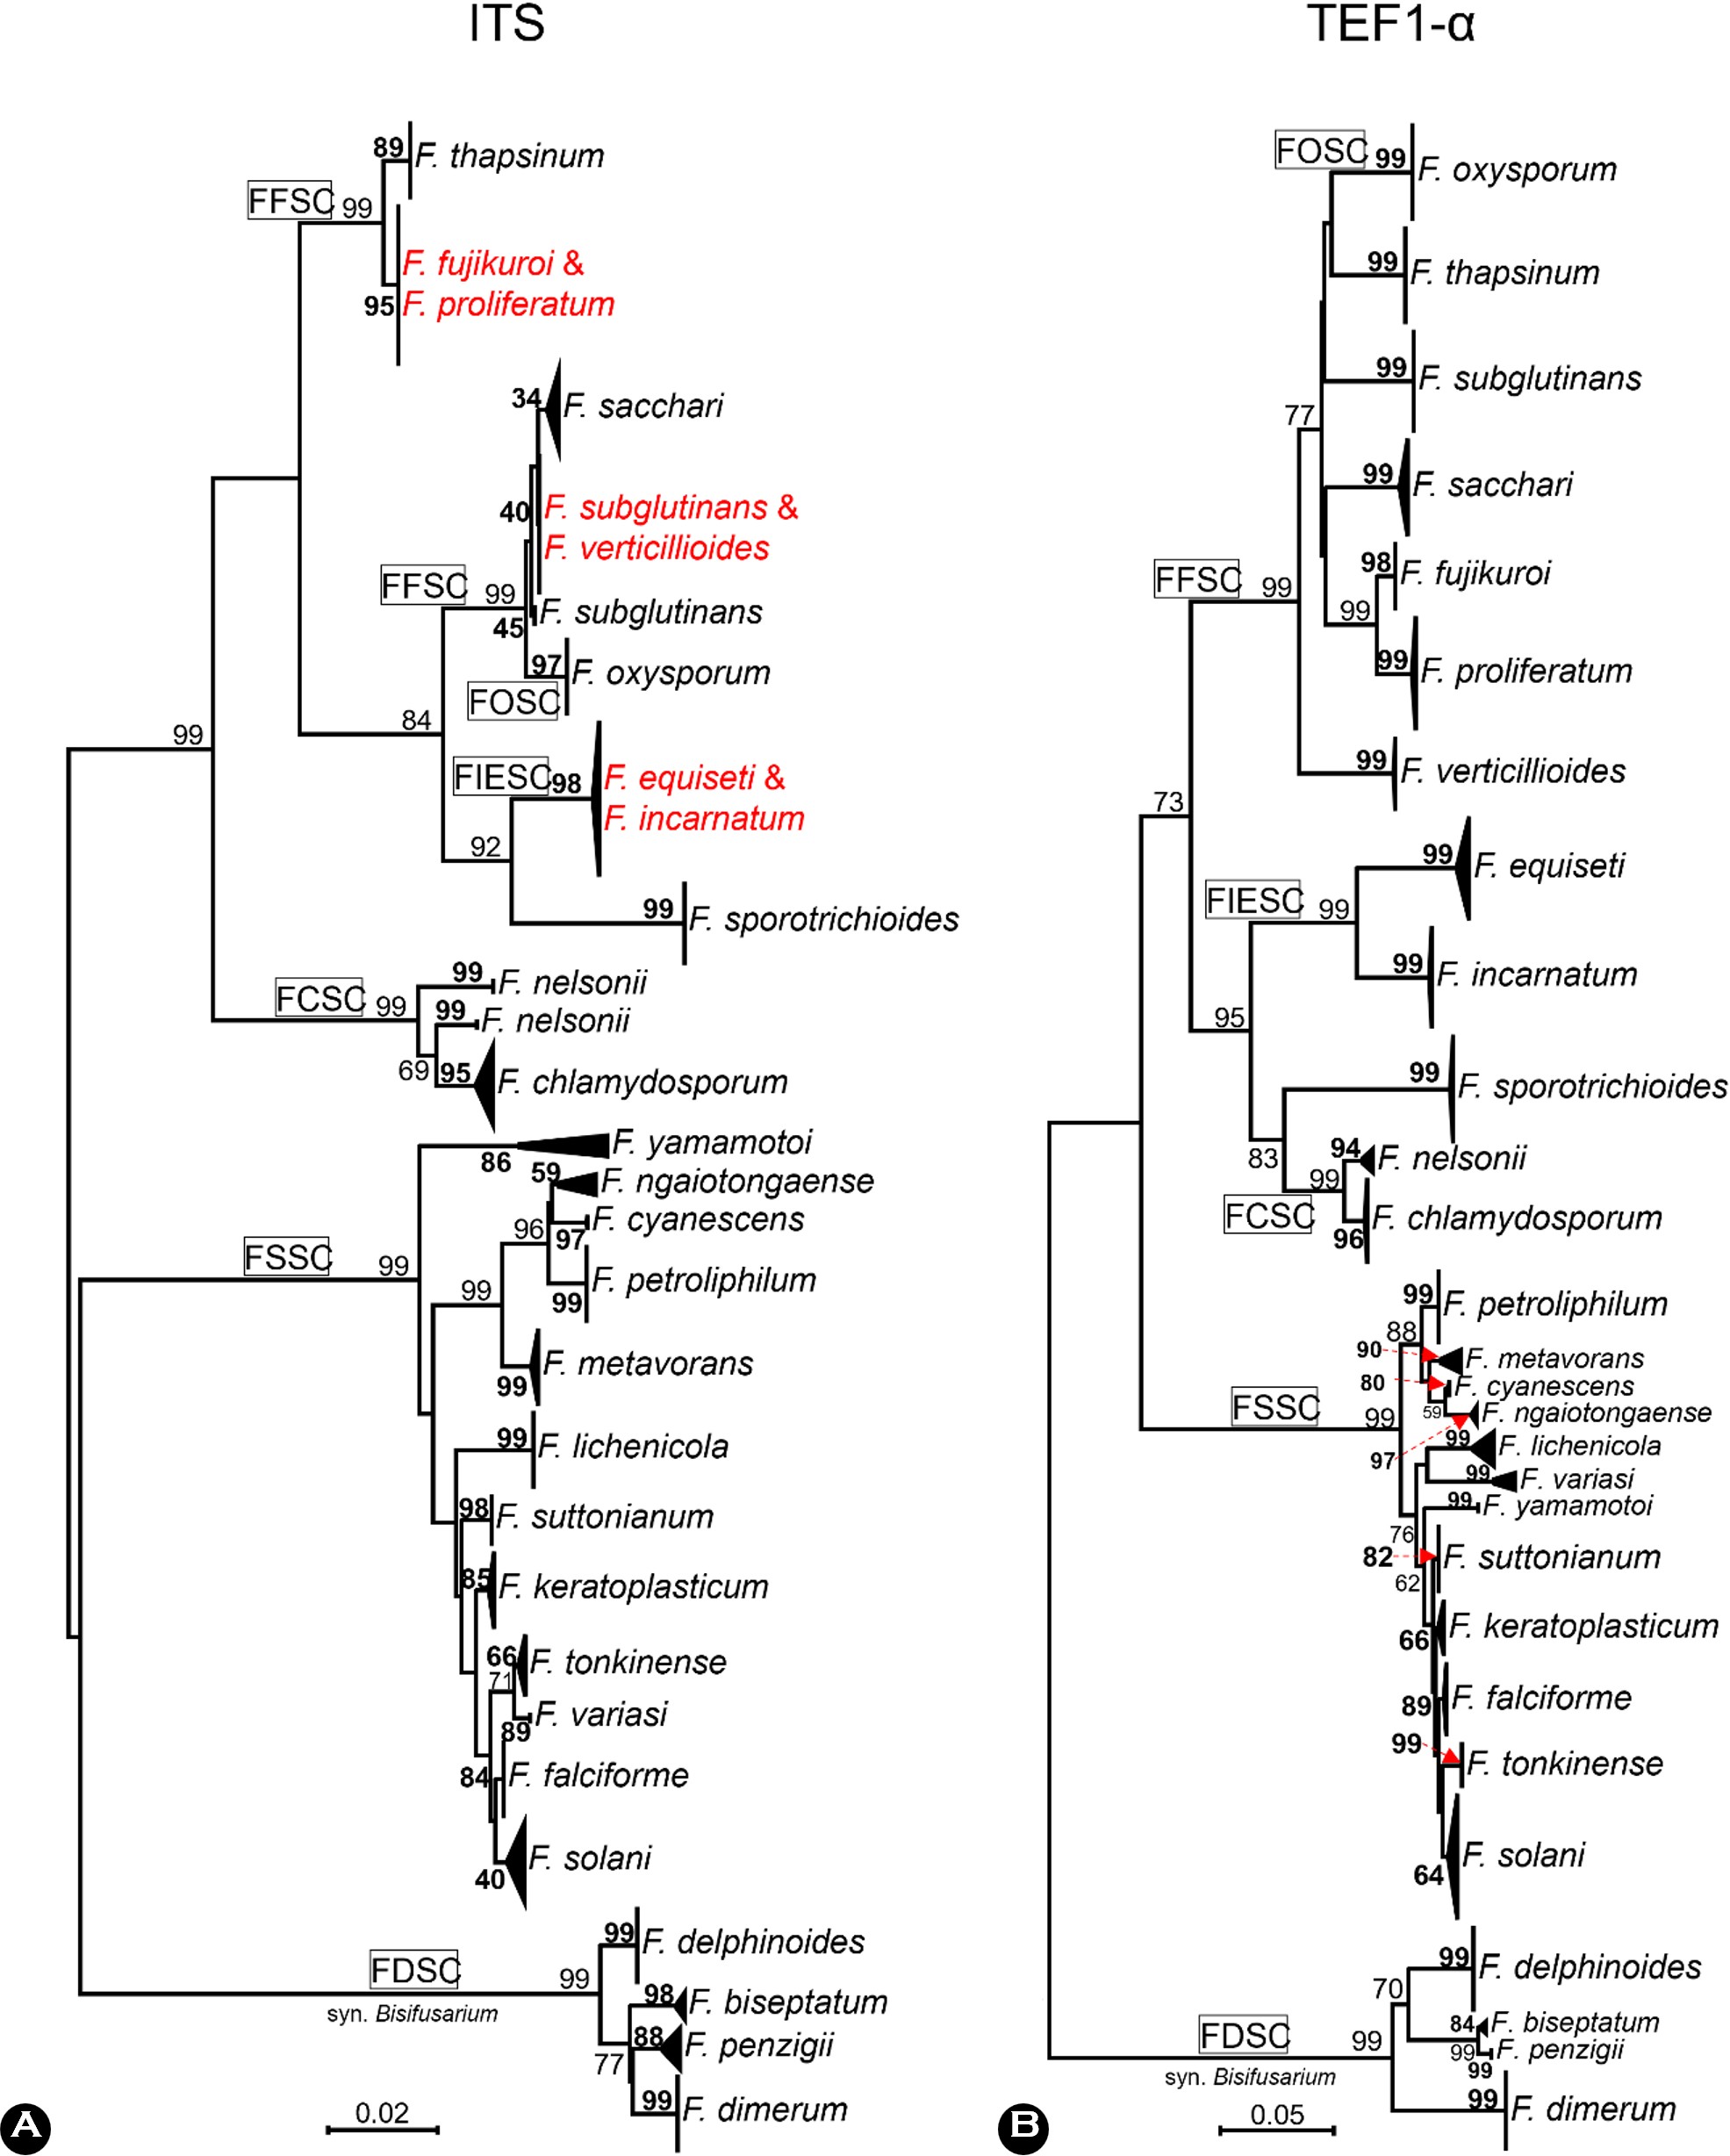
The NJ tree based on the 341 ITS sequences, as depicted with collapsed species nodes in Fig. 1A, produced 21 mono- phyletic species, of which 17 were categorized as good resolution, whereas 4 species, F. solani, F. tonkinense, F. ngaiotongaense, and F. sacchari, were categorized as fair resolution because of monophyly with <70% bootstrap sup- port. Along with one paraphyletic species (F. nelsonii) with >70% bootstrap support, these sequences resolved 22 of 28 species. Six species showed poor resolution, clustering into three species pairs, viz., F. subglutinans–F. verticillioides complex, F. equiseti–F. incarnatum complex, and F. fujikuroi–F. proliferatum complex. Based on the NJ tree of the 320 TEF1-α sequences as depicted with collapsed species nodes in Fig. 1B, 26 species demonstrated good resolution, and 2 species (F. keratoplasticum and F. solani) exhibited fair resolution due to bootstrap support of <70%. All the three species complexes that ITS failed to resolve were successfully resolved as distinct species.
3. Barcoding gap analysis
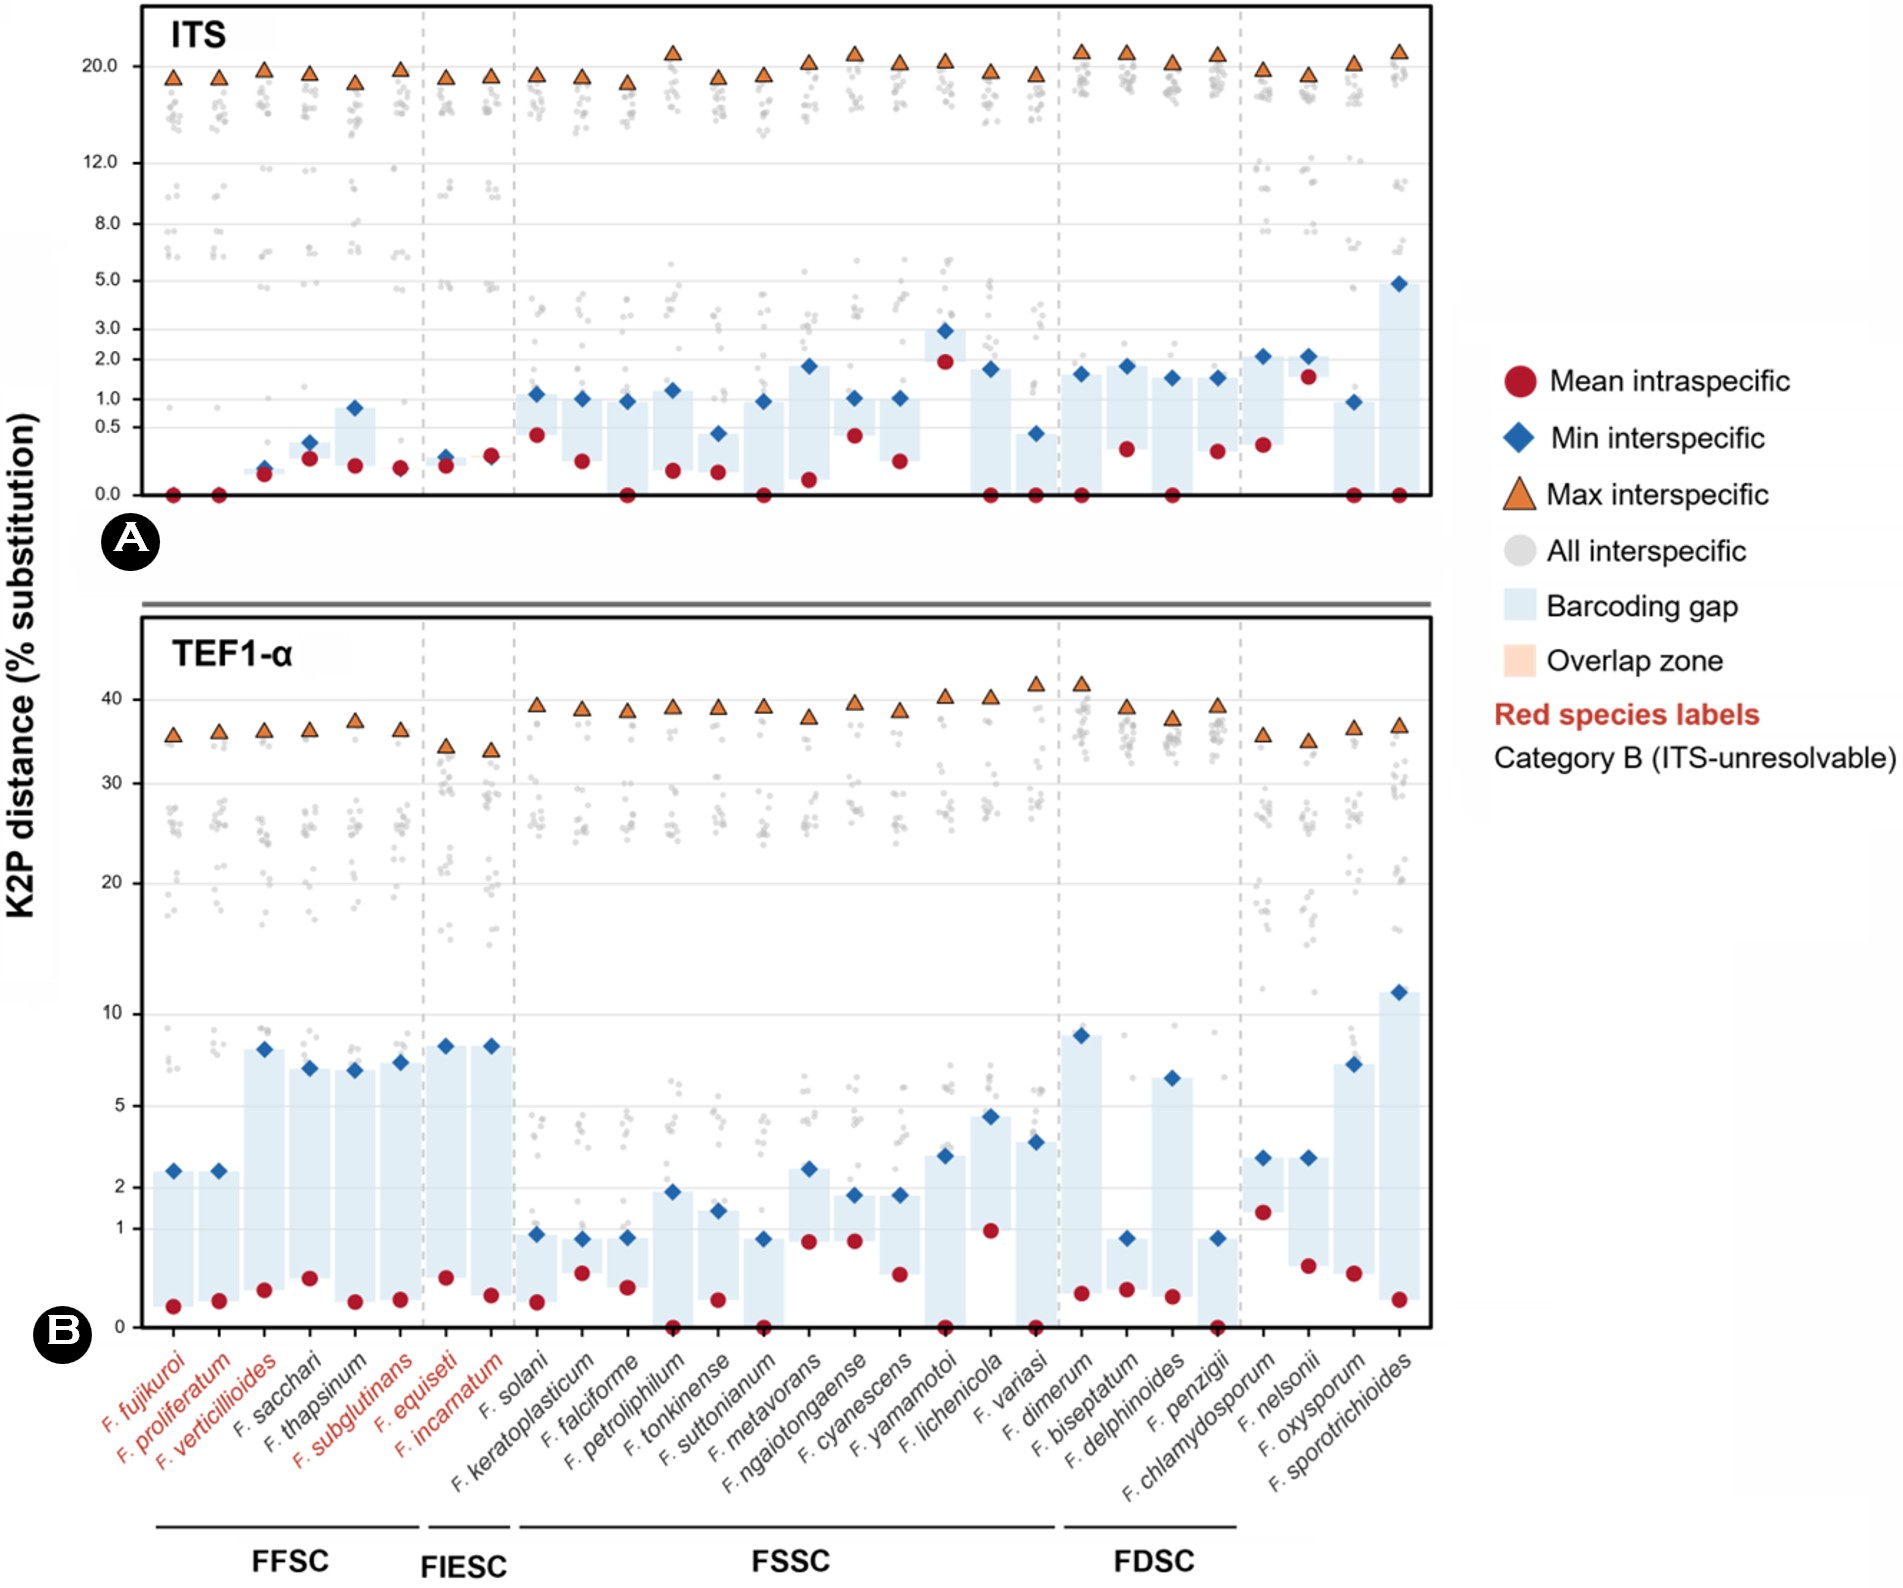
Based on the ITS dataset, as depicted in Fig. 2A and Table 4, the mean K2P intraspecific distance was 0% in 10 species. The maximum of mean intraspecific distances was 1.9314% in F. yamamotoi. A total of 24 species exhibited a positive barcoding gap compared with the other 27 species (i.e., mean intraspecific distance < minimum interspecific distance). No barcoding gap was found between three pairs of species, viz., F. fujikuroi vs F. proliferatum (0%), F. subglutinans vs F. verticillioides (-0.0054%), and F. incarnatum vs F. equiseti (-0.0139%). As shown in Fig. 2B and Table 4, the mean K2P intraspecific distances of TEF1-α ranged from 0% in F. penzigii, F. petroliphilum, F. yamamotoi, F. suttonianum, and F. variasi to the maximum of 1.3479% in F. chlamydosporum. The minimum interspecific distance was 0.8037% between F. keratoplasticum and F. suttonianum. All 28 species demon- strated a clear barcoding gap, with no overlap between mean intraspecific and minimum interspecific distances.
|
Group |
No. |
Species |
ITS (% substitution) |
|
TEF1-α (% substitution) |
||||
|
Mean |
Nearest |
Barcoding |
Mean |
Nearest |
Barcoding |
||||
|
FFSC |
1 |
F. thapsinum |
0.0921 |
0.8292 |
0.7371 |
|
0.0664 |
6.7551 |
6.6887 |
|
2 |
F. sacchari |
0.1432 |
0.3018 |
0.1586 |
|
0.2434 |
6.8452 |
6.6018 |
|
|
3 |
F. fujikuroi |
0.0000 |
0.0000 |
0.0000 |
|
0.0458 |
2.4954 |
2.4495 |
|
|
4 |
F. proliferatum |
0.0000 |
0.0000 |
0.0000 |
|
0.0718 |
2.4954 |
2.4236 |
|
|
5 |
F. verticillioides |
0.0461 |
0.0774 |
0.0313 |
|
0.1424 |
7.9021 |
7.7597 |
|
|
6 |
F. subglutinans |
0.0828 |
0.0774 |
-0.0054 |
|
0.0788 |
7.1677 |
7.0888 |
|
|
FOSC |
7 |
F. oxysporum |
0.0000 |
0.9452 |
0.9452 |
|
0.2969 |
7.0693 |
6.7724 |
|
FIESC |
8 |
F. equiseti |
0.0943 |
0.1558 |
0.0615 |
|
0.2505 |
8.0922 |
7.8417 |
|
9 |
F. incarnatum |
0.1697 |
0.1558 |
-0.0139 |
|
0.1059 |
8.0922 |
7.9863 |
|
|
|
10 |
F. sporotrichioides |
0.0000 |
4.8694 |
4.8694 |
|
0.0789 |
11.3707 |
11.2918 |
|
FCSC |
11 |
F. nelsonii |
1.5167 |
2.1056 |
0.5889 |
|
0.3877 |
2.9432 |
2.5555 |
|
12 |
F. chlamydosporum |
0.2745 |
2.1056 |
1.8311 |
|
1.3479 |
2.9432 |
1.5953 |
|
|
FSSC |
13 |
F. petroliphilum |
0.0647 |
1.1891 |
1.1244 |
|
0.0000 |
1.8840 |
1.8840 |
|
14 |
F. cyanescens |
0.1264 |
1.0201 |
0.8937 |
|
0.2855 |
1.7852 |
1.4997 |
|
|
15 |
F. ngaiotongaense |
0.3818 |
1.0201 |
0.6383 |
|
0.7639 |
1.7852 |
1.0213 |
|
|
16 |
F. metavorans |
0.0252 |
1.8131 |
1.7879 |
|
0.7448 |
2.5659 |
1.8211 |
|
|
17 |
F. yamamotoi |
1.9314 |
2.9480 |
1.0166 |
|
0.0000 |
3.0084 |
3.0084 |
|
|
18 |
F. suttonianum |
0.0000 |
0.9527 |
0.9527 |
|
0.0000 |
0.8037 |
0.8037 |
|
|
19 |
F. lichenicola |
0.0000 |
1.7301 |
1.7301 |
|
0.9547 |
4.5471 |
3.5924 |
|
|
20 |
F. keratoplasticum |
0.1260 |
1.0124 |
0.8864 |
|
0.3003 |
0.8037 |
0.5035 |
|
|
21 |
F. falciforme |
0.0000 |
0.9527 |
0.9527 |
|
0.1637 |
0.8209 |
0.6572 |
|
|
22 |
F. tonkinense |
0.0575 |
0.4131 |
0.3556 |
|
0.0763 |
1.3905 |
1.3142 |
|
|
23 |
F. variasi |
0.0000 |
0.4131 |
0.4131 |
|
0.0000 |
3.5139 |
3.5139 |
|
|
24 |
F. solani |
0.3932 |
1.1102 |
0.7170 |
|
0.0651 |
0.8841 |
0.8191 |
|
|
FDSC |
25 |
F. delphinoides |
0.0000 |
1.5015 |
1.5015 |
|
0.0980 |
6.3479 |
6.2499 |
|
26 |
F. biseptatum |
0.2297 |
1.8187 |
1.5889 |
|
0.1466 |
0.8113 |
0.6647 |
|
|
27 |
F. penzigii |
0.2058 |
1.5015 |
1.2957 |
|
0.0000 |
0.8113 |
0.8113 |
|
|
28 |
F. dimerum |
0.0000 |
1.5976 |
1.5976 |
|
0.1191 |
8.6984 |
8.5793 |
|
4. Evaluation of fungal species using phylogeny and barcoding gaps
As presented in Table 5, ITS could resolve 22 species (78.6%), whereas TEF1-α formally resolved 28 species (100%). For practical clinical laboratory guidance, all species were classified into two categories, viz., A and B.
|
Group |
No. |
Species |
ITS dataset |
|
TEF1-α dataset |
Category |
||||
|
Sp. res.* |
Nearest species |
Gap |
Sp. res.* |
Nearest species |
Gap |
|||||
|
FFSC |
1 |
F. thapsinum |
G |
F. fujikuroi & |
+ |
|
G |
F. fujikuroi |
+ |
A |
|
2 |
F. sacchari |
F |
F. verticillioides |
+ |
|
G |
F. fujikuroi |
+ |
A |
|
|
3 |
F. fujikuroi |
P Sp. cpx. |
F. proliferatum |
- |
|
G |
F. proliferatum |
+ |
B |
|
|
4 |
F. proliferatum |
P Sp. cpx. |
F. fujikuroi |
- |
|
G |
F. fujikuroi |
+ |
B |
|
|
5 |
F. verticillioides |
P Sp. cpx. |
F. subglutinans |
+ |
|
G |
F. thapsinum |
+ |
B |
|
|
6 |
F. subglutinans |
P Sp. cpx. |
F. verticillioides |
- |
|
G |
F. fujikuroi |
+ |
B |
|
|
FOSC |
7 |
F. oxysporum |
G |
F. subglutinans |
+ |
|
G |
F. thapsinum |
+ |
A |
|
FIESC |
8 |
F. equiseti |
P Sp. cpx. |
F. incarnatum |
+ |
|
G |
F. incarnatum |
+ |
B |
|
9 |
F. incarnatum |
P Sp. cpx. |
F. equiseti |
- |
|
G |
F. equiseti |
+ |
B |
|
|
|
10 |
F. sporotrichioides |
G |
F. incarnatum |
+ |
|
G |
F. nelsonii |
+ |
A |
|
FCSC |
11 |
F. nelsonii |
F |
F. chlamydosporum |
+ |
|
G |
F. chlamydosporum |
+ |
A |
|
12 |
F. chlamydosporum |
G |
F. nelsonii |
+ |
|
G |
F. nelsonii |
+ |
A |
|
|
FSSC |
13 |
F. petroliphilum |
G |
F. ngaiotongaense |
+ |
|
G |
F. cyanescens |
+ |
A |
|
14 |
F. cyanescens |
G |
F. ngaiotongaense |
+ |
|
G |
F. ngaiotongaense |
+ |
A |
|
|
15 |
F. ngaiotongaense |
F |
F. cyanescens |
+ |
|
G |
F. cyanescens |
+ |
A |
|
|
16 |
F. metavorans |
G |
F. ngaiotongaense |
+ |
|
G |
F. cyanescens |
+ |
A |
|
|
17 |
F. yamamotoi |
G |
F. tonkinense |
+ |
|
G |
F. solani |
+ |
A |
|
|
18 |
F. suttonianum |
G |
F. falciforme |
+ |
|
G |
F. keratoplasticum |
+ |
A |
|
|
19 |
F. lichenicola |
G |
F. falciforme |
+ |
|
G |
F. suttonianum |
+ |
A |
|
|
20 |
F. keratoplasticum |
G |
F. tonkinense |
+ |
|
F |
F. suttonianum |
+ |
A |
|
|
21 |
F. falciforme |
G |
F. suttonianum |
+ |
|
G |
F. suttonianum |
+ |
A |
|
|
22 |
F. tonkinense |
F |
F. variasi |
+ |
|
G |
F. solani |
+ |
A |
|
|
23 |
F. variasi |
G |
F. tonkinense |
+ |
|
G |
F. suttonianum |
+ |
A |
|
|
24 |
F. solani |
F |
F. tonkinense |
+ |
|
F |
F. suttonianum |
+ |
A |
|
|
FDSC |
25 |
F. delphinoides |
G |
F. penzigii |
+ |
|
G |
F. biseptatum |
+ |
A |
|
26 |
F. biseptatum |
G |
F. penzigii |
+ |
|
G |
F. penzigii |
+ |
A |
|
|
27 |
F. penzigii |
G |
F. delphinoides |
+ |
|
G |
F. biseptatum |
+ |
A |
|
|
28 |
F. dimerum |
G |
F. penzigii |
+ |
|
G |
F. biseptatum |
+ |
A |
|
|
*Sp. res. = Species
resolution: G (Good resolution), F (Fair resolution), P (Poor resolution),
Sp. cpx (Species complex) |
||||||||||
Category A consists of 22 species demonstrating clear barcoding gaps with monophyletic or paraphyletic clades in both loci. For these species, single-locus identification with either ITS or TEF1-α is sufficient. Category B contains 6 species, viz., F. equiseti, F. fujikuroi, F. incarnatum, F. proliferatum, F. subglutinans, and F. verticillioides, which ITS cannot reliably identify; therefore, TEF1-α is required.
Remarkably, although F. equiseti and F. verticillioides ex- hibited ITS barcoding gaps (+0.0615% and +0.0313%, respectively), they were classified as poor (P) because their respective sister species (F. incarnatum and F. subglutinans) lacked a mutual barcoding gap (-0.0139% and -0.0054%, respectively). Reliable single-locus identification requires posi- tive gaps in both members of a species pair; therefore, both members are classified as "P". No species in this study was classified into Category C.
This study provides systematic quantitative support for the recommendations of CLSI MM18 and previous expert con- sensus by directly comparing ITS and TEF1-α as single-locus barcodes across 28 human-pathogenic Fusarium species. We further translate those recommendations into a species-by-species resolution map directly applicable to clinical mycology laboratories.
In the present analysis, the mean rather than the maximum intraspecific distance was selected as a more stable repre- sentative of within-species divergence. This selection mitigates the impact of misidentified sequences in public Fusarium databases, which can inflate the maximum value and falsely obscure genuine barcoding gaps41. This rationale is directly illustrated by F. yamamotoi; an unusually high ITS divergence (1.9314% mean across four sequences)—potentially reflecting cryptic speciation or misidentification—would have falsely collapsed its barcoding gap had the maximum criterion been applied.
Our data demonstrate that TEF1-α outperforms ITS in the routine identification of these pathogenic Fusarium species. TEF1-α resolves boundaries between members of species complexes that ITS cannot, including the F. fujikuroi vs F. proliferatum, F. incarnatum vs F. equiseti, and F. subglutinans vs F. verticillioides species pairs. Nonetheless, ITS still provides reliable species-level identification for 22 of the 28 Fusarium species, including FSSC, which contains the most clinically encountered taxa42.
The inability of ITS to differentiate six species has direct implications for patient management, antifungal stewardship, and epidemiological surveillance. F. fujikuroi and F. pro- liferatum, indistinguishable by ITS, differ in their mycotoxin production profiles and have been associated with distinct clinical presentations within FFSC43,44. F. proliferatum is among the most frequently recovered FFSC species in human in- fections, particularly keratitis and disseminated disease in hematological patients, and studies have reported highly species-specific resistance patterns in the F. fujikuroi species complex45-47. The F. subglutinans–F. verticillioides pair pre- sents a similar problem. F. verticillioides is the most commonly encountered FFSC species worldwide, associated with con- tamination of maize and cereal crops as well as human infection, whereas F. subglutinans has a distinct host range and mycotoxin profile48,49. Within FIESC, the clinical signifi- cance of separating F. equiseti from F. incarnatum is now recognized. The precise identification of these species not only facilitates accurate source-tracing and epidemiological surveillance but also significantly optimizes patient manage- ment. This is particularly crucial considering their complex cross-infection dynamics and intrinsic multidrug-resistant pro- files against various antifungal agents50-52. Although F. nelsonii clustered paraphyletically with F. chlamydosporum on the ITS tree, the presence of a clear barcoding gap (+0.59%) between the two species permits reliable ITS-based discrimination. Both species have been reported in invasive infections in severely immunocompromised patients with aplastic anemia and lymphocytic lymphoma1,51,53.
Laboratories depending solely on ITS-based identification cannot achieve species-level resolution, often reporting isolates under broad categories such as FFSC and FIESC. This limitation obscures both local epidemiological trends and species-specific resistance patterns, potentially delaying targeted therapy and hindering the accurate interpretation of suscepti- bility testing or source-tracing efforts in clinical practice1,44,54.
Beyond discriminatory power, the feasibility of adopting TEF1-α in routine laboratory workflows depends on several practical factors, viz., the availability of reference databases, primer universality, and amplification success. The Fusarium-ID and Fusarium MLST databases, both curated by leading Fusarium taxonomists, use TEF1-α as a primary identification locus and contain extensive, quality-controlled reference sequences12,55,56. The NCBI GenBank also hosts an increasing collection of TEF1-α sequences for Fusarium, although cura- tion quality varies56. However, although ITS benefits from the largest overall fungal sequence repository (including NCBI GenBank and the ISHAM-ITS database), a large reference database provides no advantage when the target locus itself lacks discriminatory power57. For the six ITS-unresolved species identified in this study, even a well-curated ITS data- base cannot provide species-level identification because the sequences are identical or almost identical. TEF1-α can be amplified using well-established primer pairs such as EF1-1018F/EF1-1620R, EF1-728F/EF1-986R, and EF1-983F/EF1-1567R, which reliably amplify across the genus Fusarium with high success rates (>95% in published studies)31,32. TEF1-α primers, being more species-specific, can provide a cleaner amplification profile in clinical settings. A potential limitation of TEF1-α is its single-copy nature, which theoretically yields lower PCR sensitivity than the multicopy ITS region (estimated at 50-200 copies per genome in most fungi)9,32. Nevertheless, in practice, Fusarium isolates are typically cultured before molecular identification in clinical laboratories, ensuring adequate DNA template concentrations. For direct-from-specimen identification (e.g., corneal scrapings and tissue biopsies), ITS may still provide a sensitivity advantage for initial detection, after which TEF1-α can be applied for definitive species-level identification58,59. A tiered approach—ITS for pan-fungal screening and complex-level assignment, followed by reflex TEF1-α sequencing for Fusarium species identification—may represent the most practical workflow for laboratories that must maintain broad fungal detection capability.
This study investigated only a single-locus barcoding appro- ach. Multilocus sequence analysis (MLSA), typically combining TEF1-α with RPB1, RPB2, and occasionally β-tubulin (TUB2) or calmodulin (CaM), remains the gold standard for fine-scale taxonomic discrimination, recognition of cryptic species, and outbreak-investigation work in Fusarium60,61. The single-locus framework presented here is primarily designed for routine clinical mycology workflows where rapid turnaround, cost-effectiveness, and accuracy are key practical considerations. MLSA-based confirmation must be considered when single-locus results are ambiguous, when novel or atypical clinical phenotypes are encountered, or when epidemiological in- vestigation requires subspecies resolution.
Our species-by-species resolution map (Table 5) provides a pragmatic decision framework. For the 22 Category A species that both ITS and TEF1-α can reliably identify, laboratories with established ITS-based workflows do not need to change their current protocol. Nevertheless, when an ITS result matches one of the six Category B species—specifically, the species pairs F. fujikuroi / F. proliferatum, F. equiseti / F. incarnatum, or F. subglutinans / F. verticillioides—reflex TEF1-α sequencing must be performed. TEF1-α successfully resolved all the 28 species, whereas ITS resolved only 22 of 28 species (78.6%). Therefore, laboratories establishing new molecular pipelines for Fusarium identification must adopt TEF1-α as the primary barcode from the start. The curated reference datasets and resolution map provided here can be used directly as a reference framework, thus reducing the need for complex bioinformatics infrastructure.
Several limitations of this study must be noted. First, the assessment is entirely in silico and based on publicly avail- able reference sequences; key wet-laboratory performance parameters—including PCR amplification success rate, sequen- cing failure rate, performance with mixed templates, and direct-from-specimen sensitivity from clinical specimens—require prospective validation. Second, the rapidly evolving taxonomy of Fusarium produces nomenclatural challenges, exemplified by the recent reclassification of the F. dimerum species complex into Bisifusarium18. Despite conflicting Gen- Bank annotations, we retained the "Fusarium" nomenclature to maintain consistency with clinical literature. As phylo- genomic data continue to refine species boundaries, adopting laboratories must monitor MycoBank for necessary updates.
In conclusion, TEF1-α must be adopted as the primary single-locus marker or alternatively as a reflex marker after pan-fungal ITS screening, particularly for isolates belonging to the F. fujikuroi, F. incarnatum–equiseti, and F. subglutinans–verticillioides species groups.
References
1. 1. Nucci M, Anaissie E. Invasive fusariosis. Clin Microbiol Rev 2023;36:e00159-22 https://dx.doi.org/10.1128/cmr.00159-22
Google Scholar
Congratulatory MessageClick here!